I spent months creating a new free offer. Here’s what I learned.
At the beginning of this year, I set a goal for myself that I wanted to share the knowledge and methodology behind my work with more people. I’ve seen how Lean transformed businesses I’ve worked with from inefficient, disorganized, and resource-constrained to efficient, data-driven, and scalable. I want others to be able to achieve the same results. So over the past few months, I’ve been working to make that happen.
I recently released the BE Lean Assessment - a free tool to give business owners expert insight into whether they have the systems, structure, and culture in place to achieve sustainable growth.
I’d love for you to check out the assessment. But in the spirit of my goal to share my process, I thought it would also be fun to take you behind the scenes and show you how I’m running this project as a lean experiment. And I have some early results to share on how it’s going so far.
Setting up and running the experiment
Every good experiment starts with a hypothesis. Mine was that distributing the Lean Assessment through targeted channels would result in a 2% completion rate. I have a separate hypothesis for how I educate and engage with those who complete the assessment, but that’s for another time.
My first push was to distribute the assessment through my email list. Here were the results of that campaign:
58% opened the email
22% clicked through to the assessment
8% completed the assessment

I’m thrilled with the email open and click through rates. Average open rates for email campaigns are typically around 20%, and click through rates average 2.5%. I also well exceeded the 2% assessment completion benchmark in my hypothesis.
My next push was on LinkedIn. The results told a different story.
I gained about 1,000 impressions
3% clicked through to the assessment
0% completed the assessment
The average click through rate on LinkedIn is about 0.4%. So again I’m pleased with the click through results. But the fact that none of those people actually completed the assessment was a problem.
I used a software called Typeform to create the assessment, and their research shows that on average, 57% of people who open a Typeform complete it. In my case, 37% of my email list visitors completed the assessment, and none of the LinkedIn audience did.
Learning and iterating on the results
With knowledge comes power. Before I ran the experiment, I defined the benchmark for validating my hypothesis. But I also identified the specific data points I would measure that would explain to me what contributed to my results. This was crucial because that data pointed me to exactly where I needed to improve - the design of the assessment itself. So I got to work.
I experimented with several versions of the landing page verbiage, ultimately choosing to pair it down significantly. I also cut out a couple of questions, added some graphics for visual interest, and chose a new background color to give the tool a little more energy and a sense of fun.
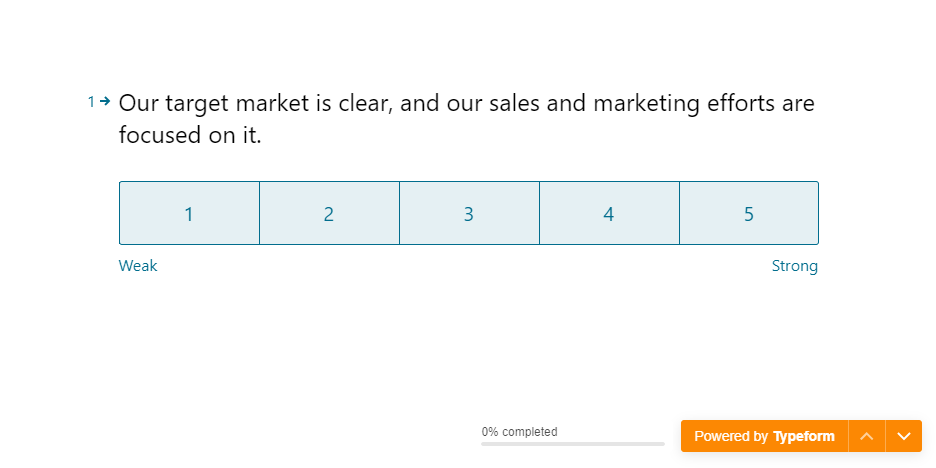
The original design of the Lean Assessment
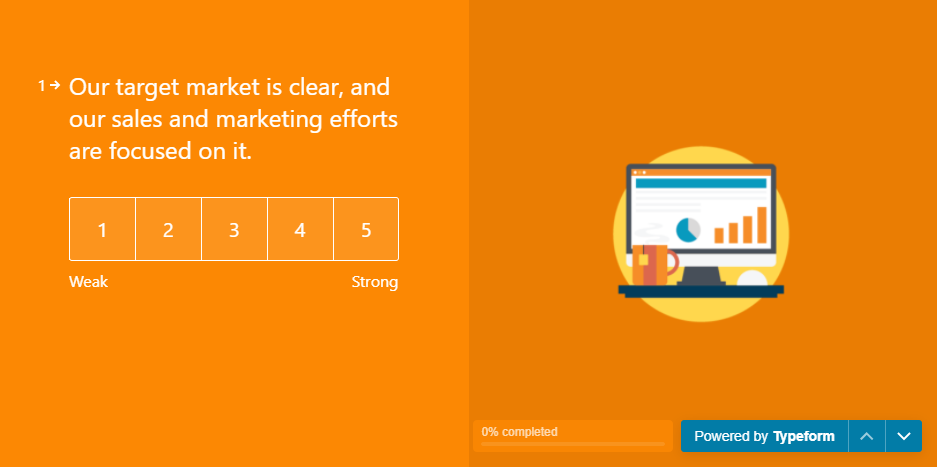
The improved design of the lean assessment
So now it’s time to run the next iteration of the experiment and see what the results will show!
But I need your help.
If you’re an entrepreneur or small business owner, please take 3 minutes to check out the improved BE Lean Assessment and get your lean score.
And you if want to see how this experiment and others turn out, make sure to sign up below and I’ll keep you in the loop with my progress and all that I’m learning along the way.